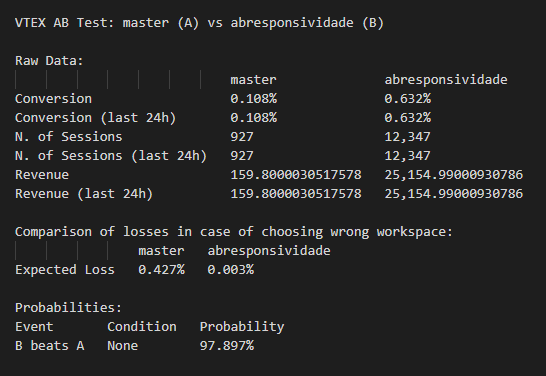
From what I saw in the vtex.ab-tester code, in the case of revenue it enters a loop and starts fetching order revenue data from the start of the test until now, in groups of five minutes.
The actual revenue value reported for each workspace can be interpreted as the total value of orders placed by users navigating in the version of your store associated to that workspace. If your store is configured to report revenue in dollars, the numbers you see are the dollar amount, with . as the decimal separator.
However, it’s important to note that A/B testing can auto-adjust the traffic in tested workspaces. This is important for two reasons:
- We don’t want to make visitors go to a version that is clearly worse, when we are confident that it is worse.
- Moving traffic to a better version improves its “analysis” and then the “true” value of its conversion is calculated faster, which helps the convergence of the test.
You can read more about this in the Running A/B tests guide in our Developer Portal.
Some mathematical concepts from our internal docs
Here are some important mathematical concepts used in the A/B test.
First, we will take the simplifying hypothesis of regarding only the conversion rate or revenue as the metric to be optimized. Now we should understand where it appears. We model our optimization problem in the following way:
-
The conversion rate is considered a random variable with an unknown probability distribution. Our model considers that it follows a Beta distribution.
-
The Beta distribution has two parameters, which are (a, b) and represents (<number of sessions with orders> + 1 , <number of sessions without orders> + 1). So the “unknown probability distribution” translates into unknown parameters of the Beta distribution.
-
To learn these parameters we look at the numbers provided by user sessions and how many had an item purchase and how many hadn’t. If before we have a Beta distribution with parameters (a, b), we update our “belief” as follows:
- If the user bought something after the session, we update the parameters to
(a+1, b)
- If the user did not buy anything after the session, we update the parameters to
(a, b+1)
Then we must understand some functions calculated to evaluate the performance of each workspace. These are the Expected Loss and B beats A values.
The ExpectedLoss of choosing workspaceA instead of workspaceB is the expected value of X_b-X_a, where X_a represents the random variable that describes the metric observed for workspaceA and X_b represents the random variable for workspaceB, but only calculated for events such that X_b>X_a.
The probability of B beats A is calculated for any workspace other than master being the “B” and master being the “A”. To calculate it we just consider the joint distribution of random variables X_a and X_b and calculate the probability of X_b>X_a.
Example of Expected Loss
Think about a game where you play against a bank roll a fair dice and look the top face of it. The value that appears is the number of dollars the bank will give you.
What is the expectation of money that you’ll win playing this game? It’s easy to calculate, just 1/6+2/6+3/6+4/6+5/6+6/6 = 3.5.
Now we’ll change the game a bit. Suppose that when the number in the top face is an odd number you receive nothing and when is even you receive that amount of dollars.
The expectation is very likely the last one we calculated but now you receive 0 dollars when the number is odd, so the value can be calculated as 0/6+2/6+0/6+4/6+0/6+6/6 = 2.
The expected value in this game is very similar to the one we calculate in Expected Loss.
As the name suggests, we’re calculating the expected value of loss choosing a variant. Well, when this variant is better than the other we don’t have any loss, so it’s 0. Otherwise there is some loss and we will associate to it its probability of happening.
